Monday, October 26, 2009

Crystal Reports Multi-line If - Then - Else blocks

I've been working with some inherited Crystal Reports today and came across something that I've seen a few times in the past as well. So, I suspect there might be quite a few folks out there who aren't aware of the way to write IF-THEN-ELSE blocks in Crystal Reports when more than one line is required to be executed in each of the code blocks.


The most likely way someone might try would be:

But, alas, this won't work. You'll get the following error:


Most people seem to hit this error and get around it by just building a different IF-THEN-ELSE block for each of the lines, so if there were 10 lines in each of the blocks there would be 10 almost identical IF-THEN-ELSE statements.


There is a better way. The trick is to convince Crystal that you only have a single statement in each of the code blocks - i.e. one statement for the IF block and another for the ELSE block. You can do this by enclosing each block in a set of parameters, like this:


There key thing to remember when doing this with an ELSE clause is to make sure that the semi-colon for the last line of the code for the IF block is inside the closing bracket for that block. If you don't then Crystal will think that the semi-colon is terminating the entire IF-THEN-ELSE block.


Thursday, October 15, 2009

Controlling Colours in Reporting Services 2005

People familiar with Excel's chart wizard will know that it is very easy to set colours for a data series. It's very much a graphical point and click process. Things aren't quite so easy or obvious with Reporting Services. I've seen this cause problems during past development projects which consolidate reports from spreadmart sources into a central BI service centre. Often users will have developed Excel based reports with particular colours in various charts and will want those colours carried forward into the new centralised Reporting Services versions of those reports in order to convey or highlight meaning. I have seen developers tell end users that the colour selections can't be carried across as the new tool lacks the functionality to control colour.

This isn't true. It may not be immediately apparent - but it is reasonably straightforward to set the colour for a data series. If only one colour is required then it can be set by following the steps below:
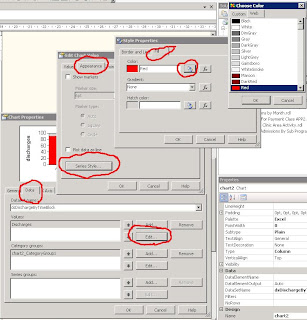
  1. Open the Chart Properties
  2. Select the Data tab
  3. Press the Edit button for the Values section
  4. Select the Appearance tab
  5. Press the Series Style button
  6. Select the Fill tab
  7. Press the Colour button
  8. Select the colour required.


It's also possible to control the colour of different elements within the chart. The example below shows discharges from a health care facility across various blocks of time during the day. The chart can be given more impact by highighting discharges that occur outside of the expected times. To show this we set the colour of bars for the worst times to be red, the bars for the less severe breaches to be yellow and the remaining bars for discharges in compliant times to be green.

A little code is required to achieve this. Firstly bring up the Style properties window in the same way as you would to just set one colour. But rather than using the colour button, select the function button that sits beside it.


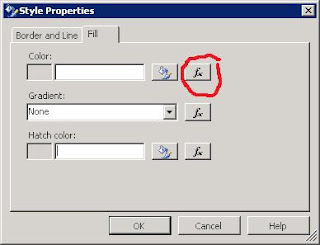
The following code will set the colour of the chart's bars.


=Switch(Fields!TimeBlock.Value = "1600 - 1800" OR Fields!TimeBlock.Value = "Unknown", "Yellow", Fields!TimeBlock.Value = "Pre 10am" OR Fields!TimeBlock.Value = "1800 - 2400", "Red", 1=1, "Green")


The Switch statement in Reporting Services works in much the same way as T-SQL's CASE statement. There is no specific equivalent of the ELSE part of the CASE statement. In this example I've used an expression which will always be true (1=1) to force a default colour of green.


The end result is a chart in which the colours are not automatically set by SSRS, but rather are choosen and selected based upon data values found at runtime.


Monday, October 12, 2009

Formatting Total Rows and Columns with Reporting Services

I’ve not had a need to build a matrix report in Reporting Services. Most of my past projects that needed these types of reports all seemed to have Crystal Reports as the report development tool. Crystal’s crosstab reports handle this requirement easily and are quite intuitive to use (or perhaps it just seems that way to me as I’ve used the tool for such a long time now).

I expected Reporting Services’ matrix to be similarly easy to use, and in general it was. I had the skeleton of my first matrix report up and running in only a few minutes. But when it came time to tidy up the formatting I struck a stumbling block. I wanted my report to have both column and row totals with a bolded typeface. Easy? Click on the total textbox and set the font weight - right? The report preview suggests that's not the case. While the column and row headers are bold - the totals themselves are not.

After a bit of trial and error I found where I was going wrong. The trick is to ensure that you edit the properties of the textbox (which affects the row or column label) but you also edit the properties of the subtotal as well. You get to this by ensuring you click on the green symbol in the top right corner of the textbox.

Click on the green area and look at your properties window - it should now be showing the subtotal properties. Format away. If, like me, you simply need a bold typeface then expand the Font property group and set the FontWeight property to Bold.


All being well you shoud now have bolded row and column totals!


Friday, October 9, 2009

Dynamic Chart Titles with SQL Server 2005 Reporting Services


I noticed the comment that there was no support for using parameters in chart titles in SSRS 2005, only in SSRS 2008. I’ve always been lucky enough to have access to the full Dundas Charts product when working with SSRS 2005 on past projects, but am now working on a project where we only have access to the standard SSRS2005 chart control so was curious if this (suggested) limitation would prove a problem or not.
So I created a quick test report and added a chart control. Bringing up the properties window showed that the chart title had an option to deal with basic formatting, but indeed no expression builder.

Undeterred, I added a report parameter and I tried simply typing in a chart title which contained parameters:

=Parameters!ParameterName.Value + " the rest of my chart title"

A switch to preview mode showed it worked. The chart title changed dynamically at run time with the parameter value.

Given that win I decided to push my luck and see if I could add some more complex logic. So I added a second report parameter and typed the following expression in the chart title textbox:

=IIf(Len(Parameters!ParameterName.Value) >1, Parameters!ParameterName.Value + " the rest of my chart title", Parameters!SecondParamterName.Value + " the rest of my chart title")

Back in to preview mode and again success!

So it would seem that there is support for the use of parameters in SSRS2005 chart titles after all.

For more complex expressions I tried creating a textbox on the main report palette as a scratchpad so I could use the expression builder and save the need to type the entire expression. From here it was a simple matter of a copy and paste across to the chart title textbox. The only shortcoming I found was that the title textbox is only single line so I needed to ensure that my expression had no line breaks in it. Failure to do this would result in only the first line of the expression being pasted successfully.

Those people lucky enough to be working with SSRS 2008 have an expression builder inside the chart title properties, but for the rest of us this approach provides a reasonably painless alternative.